
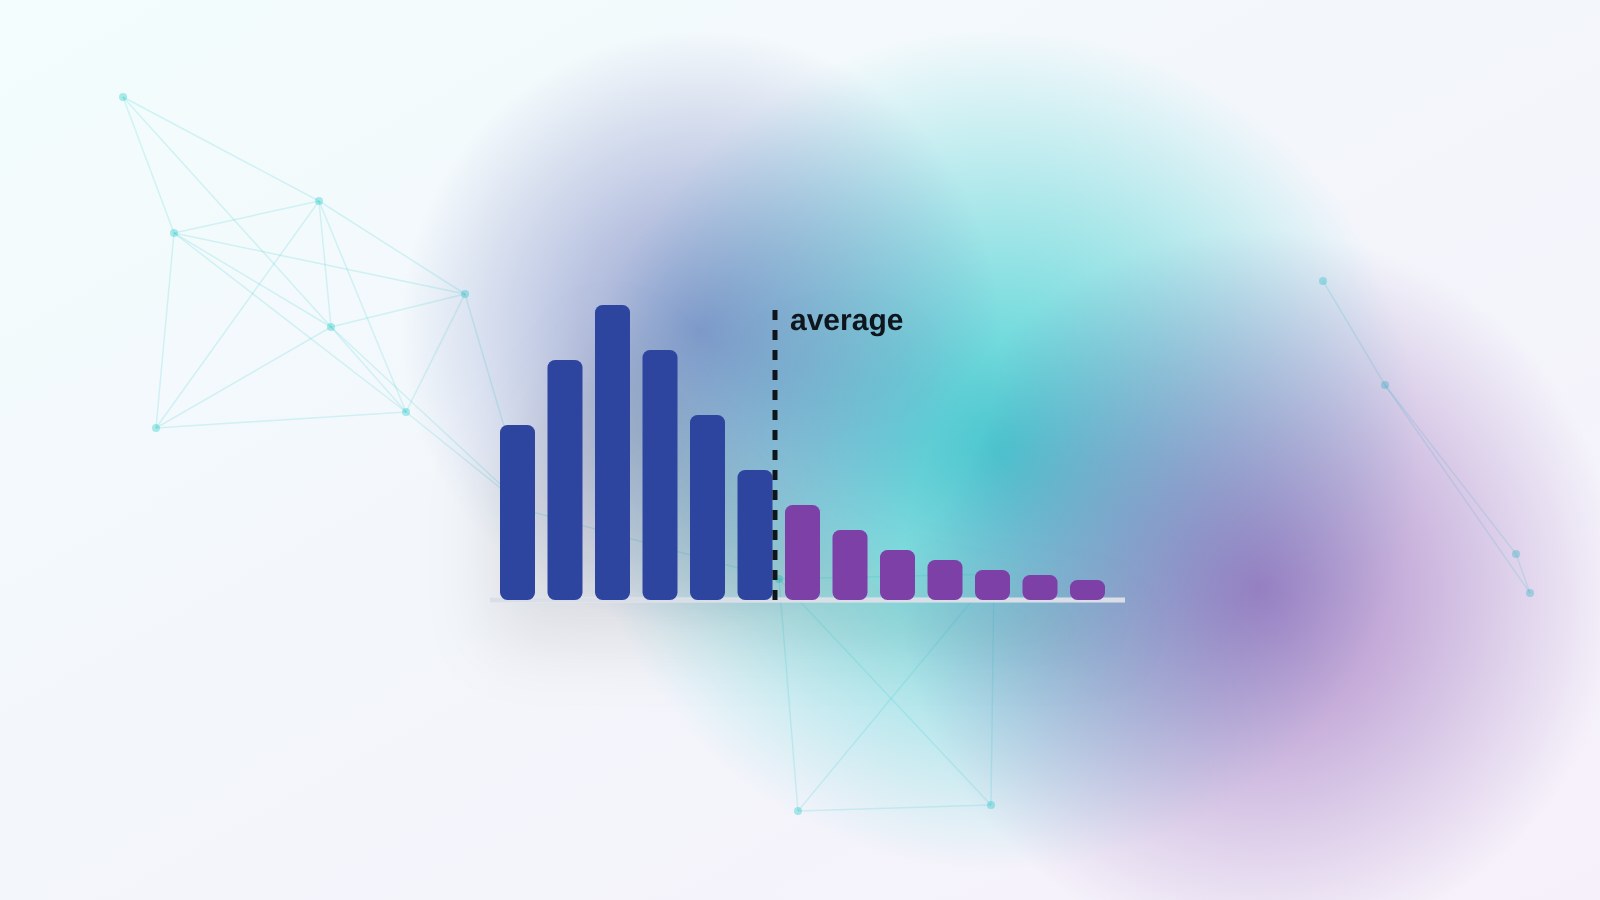

A river with an average depth of one metre can still drown you. The average tells you nothing about the deep part.
Frequency reporting has the same problem, and it costs more than most people think. So this piece is one worked example, start to finish, with the maths shown. If you buy any video or connected TV, you can run it on your own numbers before lunch.
Two campaigns, one average
Campaign A and Campaign B both spend US$1 million. Both reach one million households. Both report an average frequency of 6. On the post-buy report they look identical.
Inside, they are not. Campaign A reached most households four to eight times and almost nobody more than twelve. Campaign B reached most households two or three times, and 15% of households thirty times or more.
That pattern is not invented. EDO looked at live streaming campaigns in 2026 and found that a "healthy" average of six could hide 15% of households at 30 or more exposures, with 24 to 38% of the budget recoverable. In India, an ad-fraud monitoring firm found 15.86% of festive CTV impressions this year broke the cap that had been set for them. In the US, eMarketer research found 62% of streaming subscribers had seen the same ad more than once in a single session.
The maths
One million households at an average of 6 is six million impressions. Campaign B's heavy group is 15% of households, which is 150,000 homes, at 30 exposures each. That group alone consumed 4.5 million impressions, which is 75% of the whole campaign, on 15% of the audience.
Say your effective frequency for this product is 8. The excess in the heavy group is 22 exposures per household. 150,000 × 22 is 3.3 million wasted impressions, which is 55% of spend. On a US$1 million campaign that is about US$550,000.
You will not see any of this in the average. You will see a 6.
Why the cap does not catch it
Caps are set per platform, per device and per campaign line. A household is none of those things.
The ARF's DASH study (9 September 2026) found about two-thirds of US TV homes have a bedroom television. In 63% of homes with two sets, the sets are different brands. In one home in seven, the bedroom set is the most-watched TV in the house. A cap built on one manufacturer's data cannot see the other set. It is capping half the home.
Then add ad load. Ampere Analysis data reported by Business Insider shows ad minutes per hour on streaming services rose 18% between January and August 2026. More slots, same audience, no shared cap. The arithmetic only goes one way.
Why you keep being sold the average
Averages are easier to sell. One seller's 41% "duplication" figure has appeared this year as a share of households, then as a share of impressions, then as US$9.3 billion of waste multiplied into US$141 billion of lost sales, as ADOTAT laid out on 15 September 2026. Same number, three denominators, one sales deck. When the leading public statistic changes meaning between documents, you cannot write a frequency rule into a contract. Which is the point of asking for the distribution instead.
Four lines for the contract schedule
The frequency distribution per household in every post-buy report, in buckets: 1 to 3, 4 to 8, 9 to 15, 16 to 30, 31 and above.
The share of impressions above your stated effective frequency. This is your waste number. Agree it before the campaign, not after.
The identity method behind the cap: device, IP address or household graph. Ask which, and what it cannot see.
The make-good rule for impressions above the cap: credit, re-delivery or nothing. If a seller cannot give you line one, it cannot honour line four.
The workaround
If your platform will not give you the distribution, pull log-level data for one week and count impressions per household ID (or per IP where that is all you have). Sort descending. Look at the top 15%. That is your answer, and it took a pivot table.
What we do about it
Our platform reads delivery at household level wherever the data allows, and it never judges a CTV line on cost per acquisition, because CTV is a reach medium and should be held to reach-and-frequency rules against the client's plan. When the tail grows, the alert says how much budget is sitting above the cap, in money, not in percentages of an average.
Sources
EDO, "The silent killer of streaming TV budgets", 2026: https://www.edo.com/resources/the-silent-killer-of-streaming-tv-budgets-and-the-easy-button-that-fixes-it
BestMediaInfo citing an Indian ad-fraud monitoring firm's festive CTV analysis, 16 September 2026: https://bestmediainfo.com/mediainfo/television/indias-festive-boom-is-pouring-big-money-in-ctv-and-the-fraudsters-are-watching-12539012
ADOTAT, "Unmeasured: Samsung sells the fix for 41% duplication", 15 September 2026 (also the ARF DASH figures and Ampere Analysis ad-load data cited there): https://new.adotat.com/
Further reading
- ARF DASH TV Universe Study, The ARF Advertising Research Foundation Home page of the DASH study, which the MRC accredited in 2026.
- ARF: Bedroom TV viewing create blind spot for measurement firms The Desk Plain English summary of the bedroom TV findings and why caps miss the second set.
- Omnicom and Disney tackle CTV ad fatigue with sequential creative eMarketer Shows one buyer and one seller acting on the same repetition data.
- Measuring reach and frequency, Display & Video 360 Help Google Display & Video 360 Help Where DV360 reports frequency buckets, the receipt the article asks for.